
Reading the Report
The Risk Assessment turns your threat model into a single, scannable draft risk report: an executive summary at the top and a set of analytical tabs below it. This guide explains how to read what you see — what a matrix cell means, how coverage is stated, what a severity band is (and is not), and how to interpret each tab.
The report is deliberately conservative. Every value on screen is a band (a relative rating), a count, or a count with a denominator — traceable to your own model. There is no single "risk score", and there is no flattering aggregate that rolls everything up into one reassuring number. When the report cannot assess something, it shows you that gap rather than hiding it.
Before you start. This guide assumes a report has already been generated for your model. If you have not generated one yet, see Getting Started.
How the report is laid out
A generated report has three stacked regions, read top to bottom:
| Region | What it is |
|---|---|
| Freshness header | A line reading "Reflects the model as of <date>" and the Recreate button. If your model has changed since the report was generated, an amber "model changed" notice appears here — a signal that a number below may be out of date. Regenerating is covered in Getting Started; what "stale" means in detail is in Methodology and Trust. |
| Executive band | The one-glance summary: the risk matrix, the Coverage posture strip, the Takeaway line, and a flags row. Designed so a screenshot of it stands on its own. |
| Analytical tabs | Six tabs — Priorities, Findings, Distributions, Ledger, Register, Methodology — for working through the detail. |
The rest of this guide walks the executive band first, then explains severity bands, then the tabs.
The risk matrix
The matrix is the report's headline. It is titled INHERENT EXPOSURE POSITION — as of <date>, and it plots your model's elements on two axes:
- Rows — likelihood, loudest at the top: Exposed, Reachable, Internal.
- Columns — impact, ascending: Low, Medium, High, Critical, and Unrated set off at the end.
Each cell shows a count of elements that sit at that likelihood/impact position. An empty cell shows a faint dot (·), never a bold 0.
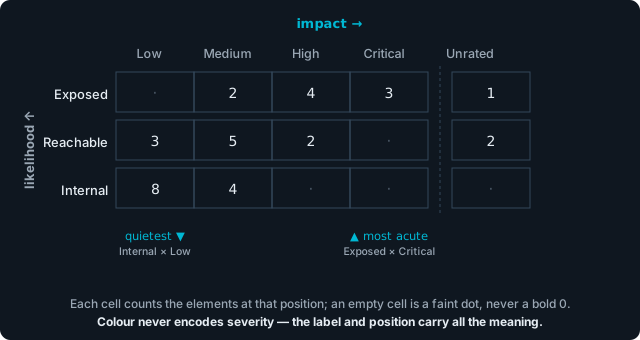
Reading a cell: pair the row (likelihood) with the column (impact). "Three elements are Exposed and Critical" (top-right) is a far sharper statement than "three elements are Internal and Low", even though both cells read 3. The Unrated column holds elements whose impact you have not yet set.
How to read a cell
Position encodes severity. The top-right corner (Exposed × Critical) is the most acute place an element can sit; the bottom-left (Internal × Low) is the quietest. The number in the cell tells you how many elements are there. Read the two together: "three elements are Exposed and Critical" is a very different sentence from "three elements are Internal and Low", even though both cells show 3.
The matrix is monochrome on purpose. It is not a green-to-red heatmap. Cells are plain outlined counts with no colour fill, and the axis labels carry all of the meaning. This is deliberate:
- Colour never does the work, so a greyscale printout, a projector, or a colour-blind reader loses nothing — the label and position still say everything.
- There is no "green = safe" cell anyone can point at. The report will not let a risk be painted comfortable.
What "inherent" means
The matrix shows the inherent position — where an element sits before you credit any controls. Controls and mitigations do not move a cell. The caption states this directly: "controls don't move these cells." What controls do move — the residual, after-controls picture — is stated separately in the Coverage posture strip and in the Residual column on the Priorities tab.
Likelihood here — Exposed / Reachable / Internal — describes where an element sits in your modeled data flows and how it can be reached, not how much effort an attacker would need. An "Exposed" element is one your model shows reachable from an outside entry point; it is a statement about topology, not about attacker skill. Impact — Low through Critical — is an ordinal proxy built from the sensitivity of the data an element handles, any regulatory flags on that data, and whether you flagged the element as a crown-jewel (critical) asset. It is never a probability or a monetary loss figure.
The Unrated column, the tray, and the reconciliation line
The matrix is honest about elements it cannot fully place:
- Unrated column. An element with no declared impact signal lands in Unrated, marked with an information icon. Unrated means "no impact signal was declared — a modeling gap, not low impact." It is a prompt to enrich your model, not a reassurance.
- The tray. Below the grid, an "N insufficient-data (tray)" line collects elements whose findings are all unscored — "not yet assessable". Click view to list them. These are held out of the grid rather than parked in a misleading cell.
- The reconciliation line. A muted line under the matrix reads, for example, "40 elements: 24 placed · 6 insufficient-data (tray) · 10 no live findings." The pieces always add back up to the total, so nothing quietly disappears.
If your model has no outside entry points, likelihood cannot be assessed at all. The matrix then shows "Likelihood not assessable — no entry origins" and collapses to a single impact-only row. This is a visible, explained degradation — not a blank space.
Drilling into a cell
Click any populated cell (or focus it and press Enter; arrow keys move between cells) to open a side drawer listing every element in that cell. The drawer header restates both numbers honestly — for example "12 elements · 18 contributing live findings — Exposed / Critical-impact" — because the cell counts elements while the drawer lists them and shows the findings behind them. From the drawer, click an element name to open its full risk profile. Search narrows the list for busy cells.
The Coverage posture strip
Beside or below the matrix sits the Coverage posture strip — the after-controls view, stated as plain counts. It reads as one sentence, for example:
Coverage posture — 4/11 top-band covered · 3 partially covered · 4 uncovered · 2 coverage unknown · 3 of the uncovered are Exposed
Read it carefully, because the design is the message:
- It is a count with a denominator, never a percentage. "4/11 covered" tells you both the numerator and the population it is measured against. The report never shows a single, flattering "covered %" that would hide how many findings are in scope.
- The population is your High and Critical findings — the "top band". Everything in the strip is measured against that same denominator, so the numbers reconcile.
- There are four states, and they are kept separate. Covered means a control clears the effectiveness bar for that finding. Partially covered means a control is present but does not reach full coverage. Uncovered means no control matched its ATT&CK techniques. Coverage unknown means the report could not decide — the finding lacks the ATT&CK technique references coverage is judged against, which is itself a modeling gap you can close. The report never folds "partially covered" or "coverage unknown" into "uncovered": "we cannot tell" is never reported as "confirmed gap."
- "N of the uncovered are Exposed" is the sharpest number here — confirmed gaps that also sit at the Exposed likelihood tier.
Every number in the strip is a live link: click it to jump to the Ledger tab filtered to exactly those findings.
If some "partially covered" findings rest on a broader, family-level control match rather than one aimed at the exact technique, a small note beneath the strip discloses how many — so the composition of that count survives up here where a reader is likely to stop, rather than only three clicks down.
When there are no High or Critical findings in scope, the strip says so plainly: "No top-band (High/Critical) findings in scope."
The Takeaway line
The Takeaway is a single, deterministic sentence assembled from the counts already shown above — never a new number, never a verdict. It is written so it can travel verbatim into board minutes. Directly beneath it, a scope note keeps it honest:
Scope: relative prioritization and coverage posture — not a calibrated risk score or loss estimate.
Read the Takeaway as a summary of where to look first, not as a grade of your overall risk.
The flags row
The flags row is the report's trust zone, and it puts the cautionary information first, before any reassuring number.
Uncertainty / conservatism flags (amber). If someone has tuned the assessment in a way that makes it less conservative — for example lowering the bar at which a finding counts as "covered", or softening how a data class maps to impact — that change is called out here by name, with its direction and who set it. For example: "Control-mitigated threshold lowered to 6.0 — more findings count as covered than at the default 7.0 (set by …)." These flags warn you that the report may over-claim relative to its defaults. Read them before you read the numbers they affect. When nothing has been tuned, this amber block does not appear.
Provenance line (neutral). Below the flags, a muted line states the report's basic accounting: how many findings were set aside by a decision (see the Ledger), how many elements and live findings are in scope, and the as-of date — for example "6 dispositioned findings excluded · 40 elements · 118 live findings · as of <date>." The excluded-findings count links to the Ledger filtered to those set-aside rows, so nothing is hidden — only excluded from the running totals, with its state intact.
Severity bands
Everywhere the report rates something, it uses a band, not a number. The vocabulary is fixed:
| Band | Meaning |
|---|---|
| Critical | The most severe rating. |
| High | Severe. |
| Medium | Moderate. |
| Low | Least severe rating that still represents a finding. |
| Unscored | A finding with no usable score — assessed but not rateable. |
| Unrated | No impact signal was declared for the element — a modeling gap, not "low". |
Three things are worth internalising:
- A band is relative, not absolute. It is an ordinal rating that places findings in order against each other, drawn from a fixed, published qualitative scale. It is not a calibrated 0–10 score, and the report never exposes one.
- Band chips are outlined, never filled, and the word always carries the meaning. Colour is redundant reinforcement only. A chip drawn with a dashed border and an authored tag marks a rating a person assigned in the register, rather than one the report computed — see The Risk Register.
- "Not assessed" is shown, not hidden. Unscored findings, Unrated impact, coverage unknown, the matrix tray, and finding types marked "not computable" are all displayed as their own honest states. The report never quietly promotes an unknown into a clean result or a confirmed gap.
You will also see a Residual band alongside the inherent Band on the Priorities tab. Residual is the rating after an effective control is credited — stepped down by at most one level from the inherent band. It is how the report shows a control helping without ever letting a control erase a risk entirely.
The analytical tabs
Below the executive band, six tabs let you work through the detail. Priorities is the default landing tab. Switching tabs keeps any filters you have applied.
| Tab | What it shows | How to read it |
|---|---|---|
| Priorities | A ranked worklist of the elements that most need attention. | The order is the message — see below. |
| Findings | The ten finding types, in two groups, each with an assurance state. | Scan the panel headers first — see below. Full catalogue in Findings. |
| Distributions | A model-wide band bar and a boundary-by-zone heatmap of where risk sits. | Counts are elements, coloured by their worst band (text only). Use the severity lens to filter. |
| Ledger | Every finding in one searchable table — the place to record decisions. | Search-first; this is where you disposition findings. See below. |
| Register | The risks a person has authored, with evidence liveness. | A separate, human-authored layer — see The Risk Register. |
| Methodology | Limitations and the no-assurance statement, the risk register's authored-not-computed ground rules, per-source counts, and the full set of resolved parameters with attribution. | Read this to understand what the numbers do and do not mean — see Methodology and Trust. |
Priorities — what pushes a row up
The Priorities tab ranks elements, not findings, and it explains its own order. Each row shows its rank (a plain ordinal, never a score badge), the element, its inherent Band and Residual band, its Likelihood and Impact, and a Fired promotions column — short chips naming the rules that lifted the row, with the full rule sentence on hover and in the expanded row.
The ordering basis is stated above the table: rows are ranked by promotion tier first, then crown-jewel assets, then the worst finding band and how many findings share it. Promotions are the load-bearing part — an element is pushed up when, for example, it is both Exposed and Critical, when it carries regulated data and is reachable, or when a confirmed gap sits on an exposed surface. Because the rank is an ordinal built from visible facts, you can always answer "why does row 3 outrank row 4" from the row itself. Expand a row for coverage, source, and the per-element actions (affirm, open profile, raise an issue, author a risk). The Top selector controls how many rows are shown.
Findings — scan the headers
The Findings tab lists ten deterministic checks in two groups: five control-gap checks (F1–F5) and five architectural / data-flow checks (F6–F10). Each check is a collapsible panel, and the panel header is the thing to scan — it shows one of three visually distinct assurance states:
- "N found" (amber) — the check fired; expand to see each instance, its evidence, and a recommended control class.
- "checked — none found" (a muted positive check) — the check ran against your model and found nothing. This is a genuine, earned all-clear for that check.
- "— not computable: <reason>" — the check could not run (for example, no crown jewels or no recognised zones to evaluate). As the panel states, absence of a result is not absence of risk.
Every finding instance links its triggering findings into the Ledger. What each of the ten checks means, when it fires, and how to act on it is the subject of Findings.
Ledger — where decisions are recorded
The Ledger is the complete list of findings and the workbench where you act on them. It is search-first: type in the search box (or press /) to narrow the list, and the count updates live. Every deep link from the executive band — a coverage number, the excluded-findings count, a distribution cell — lands here as a removable filter breadcrumb; ← back to overview clears them.
The Ledger is where you record a decision about a finding — a disposition. Keyboard triage is built in: a affirms the focused finding, r opens the disposition dialog to accept a risk with a reason, u undoes your last change, and Enter expands a row for detail. A finding you disposition is retained with its state, never deleted — an accepted risk that has since gone stale keeps an amber stale chip so it resurfaces rather than disappearing. A persisted decision can be rolled back later with the row's Clear disposition action. Two lenses are available: By finding (the default flat table) and By component (grouped), selectable at the top right.
Dispositions you make in the current session are marked "saved — pending Recreate" until you regenerate the report, at which point the executive band and tabs reflect them.
What to read next
- New to the report? Start with the Risk Assessment overview and Getting Started.
- Want the meaning of each of the ten finding types? See Findings.
- Recording and tracking authored risks? See The Risk Register.
- Producing a deck for a board or committee? See Stakeholder Reports.
- Need to know exactly what the numbers do and do not claim? See Methodology and Trust.
- Stuck on something specific? Check the FAQ.