
Getting Started
Risk Assessment turns a threat model you have built on the Dethernety platform into a grounded, board-ready draft risk report — a prioritized worklist, a likelihood × impact matrix, a security-coverage posture, ten kinds of finding, a risk register your team authors, and audience-tiered stakeholder reports and exports.
This guide is the on-ramp. It shows you where Risk Assessment lives, how to generate the report for the first time, how to read the dashboard at a glance, how to refresh the report after you change your model, and what the "your model changed" banner means. It does not go deep on interpretation — the reading guide and the trust and methodology guide do that. Follow the links as you go.
What makes this report different. It is deliberately honest and under-claims. Every number you see is a band, a count, or a coverage ratio traceable to your own model — there is no AI guess and no single black-box risk score. See Methodology and trust for the full story.
Prerequisites
Before you generate a report you need:
- A threat model on the Dethernety platform with elements, controls, data flows, and trust boundaries in place. Risk Assessment reports on what your model contains — an empty or sparse model produces a sparse report.
- The Risk Assessment analysis available in your workspace. Risk Assessment is a paid product. If you do not see it as an option, contact your administrator.
- Permission to run analyses and view results on the model. If a model opens read-only for you, you can read a report someone else generated but cannot generate or recreate one.
Opening Risk Assessment
Risk Assessment runs as an analysis of a threat model, so you reach it from the model itself.
- Open your threat model on the platform.
- Open the model's analyses. On the canvas toolbar down the left of the model, click the sparkle button (tooltip Analyses). The dialog that opens is where every analysis of the model lives.
- Add a Risk Assessment analysis. Start a new analysis and choose Risk Assessment from the list of reporting analyses. The platform creates one Risk Assessment for the model; you can keep it and revisit it later.
- Open it to view results. The Risk Assessment opens in its own view, titled Risk Assessment at the top.
The first time you open it — before you have ever run it — the view shows an empty state, not a blank page. You will see the heading No risk assessment generated yet with a short description and a single button.
Generating the report
From that empty state:
- Click Generate assessment. The report computes from your model as it stands right now.
- Wait a moment. The freshness line reads Generating assessment… while it runs. Generation reads your model and computes the whole report in one pass; it makes no external calls.
- Read the result. When it finishes, the empty state is replaced by the full dashboard, and the freshness line changes to Reflects the model as of (date and time).
That date and time is the report's as-of stamp. The report is a point-in-time draft: it reflects your model as it was the moment you generated it, and it does not silently change underneath you afterwards. Refreshing it is always your explicit action — see Refreshing after your model changes.
The dashboard at a glance
The dashboard has two parts: an executive band across the top that reads as a single unit, and a row of tabs below it for the detail.
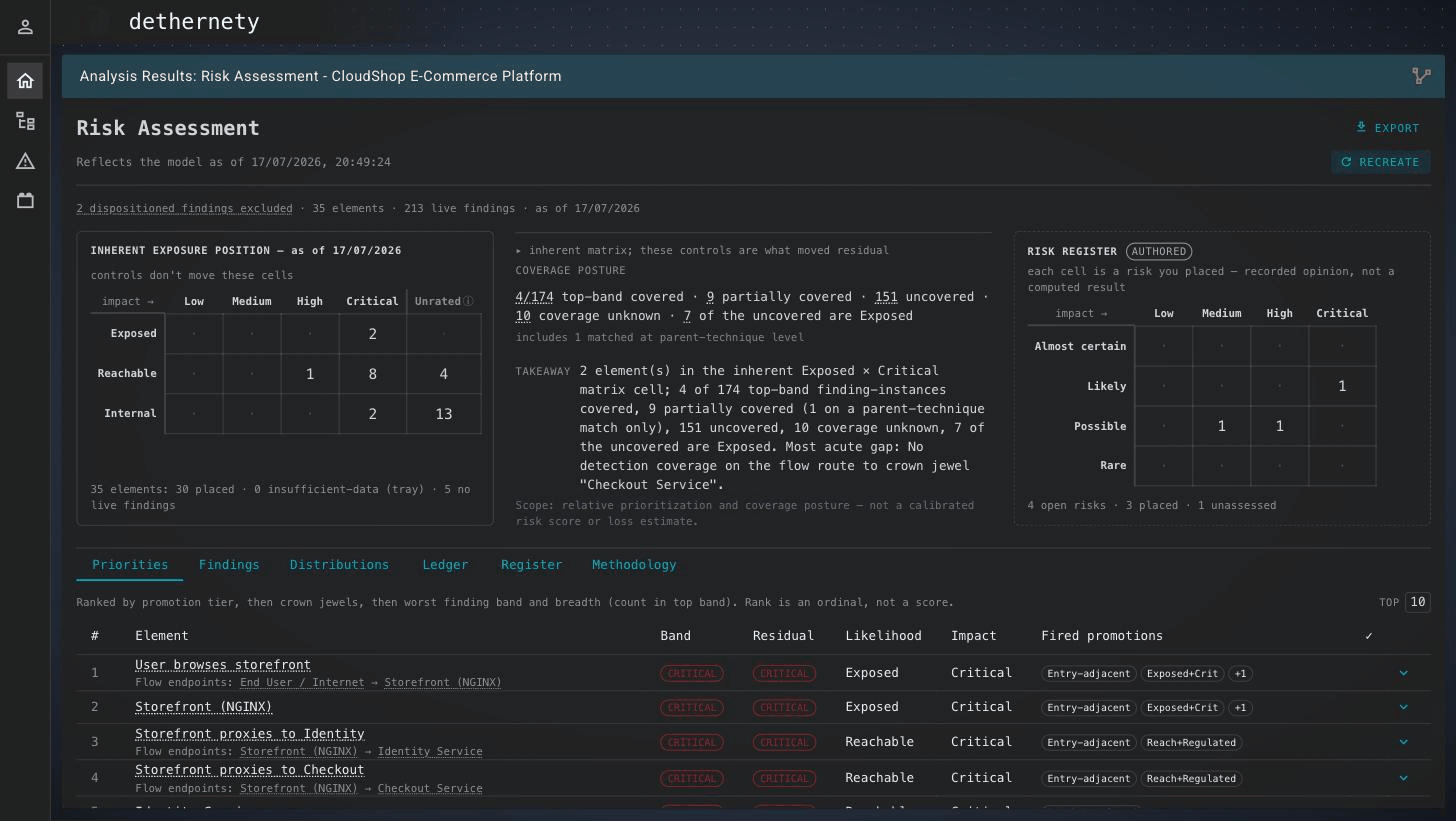
The dashboard at a glance. The executive band across the top — the exposure matrix, the coverage posture and its takeaway, and the authored risk-register matrix — sits above the tabs (Priorities, Findings, Distributions, Ledger, Register, Methodology). The header shows when the report reflects your model, with Recreate to refresh it.
The executive band
Reading top to bottom, the band gives you the whole picture before you open a single tab:
- The freshness banner. States the report's as-of date and carries the one Recreate button. When the report is out of date it also shows a short banner saying so.
- Flags and provenance. If any analysis setting makes the report less conservative than its default, it is named here in amber, with direction and who set it — so a reassuring number is never read without its caveat. Below that, a neutral line counts your model: how many findings were set aside (dispositioned), how many elements, and how many live findings.
- The risk matrix. The report's centrepiece: a likelihood × impact grid placing your findings. It is monochrome by design — position and density carry the meaning, never colour. Click any populated cell to drill into the elements behind it.
- The coverage posture. A one-line, honest account of security coverage over your highest-band findings — how many are covered, partially covered, uncovered, of unknown coverage, and how many of the uncovered are exposed. It is stated as plain counts and fractions, never a single "percent covered". Each number is a link into the Ledger.
- The takeaway. One plain-language board sentence, computed from the same counts, with a scope note reminding readers this is relative prioritization and coverage posture — not a calibrated risk score or loss estimate.
- The risk register card. Appears only once your team has authored at least one open risk in the register (see the risk register guide). Until then the band looks exactly as it did before, with a short invitation to author your first risk.
The reading guide explains how to interpret each of these in depth.
The tabs
Below the band, a row of tabs holds the detail. Each opens over the same report:
| Tab | What it holds |
|---|---|
| Priorities | The ranked worklist — your findings in priority order, with a control for how many to show. |
| Findings | The ten kinds of finding, grouped, each shown as found, checked-and-clean, or not-computable. See Findings. |
| Distributions | How your findings spread across bands and across trust zones and boundaries. |
| Ledger | The complete finding ledger — a searchable, filterable workbench where you review and set aside (dispose) findings. |
| Register | The risk records your team authors. This is the one tab you write to; see The risk register. |
| Methodology | Limitations, the exact settings the report ran under, and the sources behind it. See Methodology and trust. |
The Export menu in the header produces the audience-tiered stakeholder reports — Board, Risk Committee, Technical — and machine exports. The stakeholder reports guide covers each tier.
Refreshing after your model changes
The report is a snapshot in time. When you change your threat model — add or remove elements, adjust controls, redraw data flows or trust boundaries — the report does not update on its own. Instead, the next time you open it the freshness banner shows a "your model changed since this report was generated" notice, and the report stays fully readable while it does. Stale is not broken: nothing is blanked, and the notice simply tells you what to do. Click Recreate to compute a fresh report from the current model; the new as-of stamp replaces the old one.
Authoring a risk never triggers this banner. The risk register your team writes lives outside the computed report, so adding, editing, or closing a risk is not a "model change" and never marks the report stale. See The risk register and Methodology and trust for why. You may occasionally see a calmer, informational note (not the amber alarm) when only the underlying reference data has moved in a way that provably could not change a number — Methodology and trust explains that distinction.
Your first few minutes
Once the report is generated, a quick pass looks like this:
- Read the takeaway. One sentence, top of the band, tells you where this model stands.
- Scan the risk matrix and the top priorities. Note which cells are populated, then open the Priorities tab for the ranked worklist.
- Open one finding. In Priorities or Findings, drill into a single finding to see the evidence behind it.
- Look at the register. Open the Register tab to see how your team turns findings into managed risks.
Where to go next
Read in this order:
- Reading the report — how to interpret the matrix, coverage posture, priorities, and distributions.
- Findings — the ten kinds of finding and what each one means.
- The risk register — authoring and managing risks your team owns.
- Stakeholder reports — the Board, Risk Committee, and Technical exports.
- Methodology and trust — why every number is grounded and what the report deliberately will not claim.
- FAQ — common questions and troubleshooting.
Return to the Risk Assessment user guide index at any time.