
Quick Start
This guide takes you from nothing to your first threat finding. You install the platform on your own machine, open it, draw a small online store, run the Threat Report, and read its first finding.
What you will do
- Install the platform with one command.
- Open it in your browser.
- Draw a store: four elements in one boundary.
- Run the Threat Report.
- Read the first finding, then see what removes it.
Time to allow. The first install downloads a few GB: the container images, then an embedding model of about 1.26 GB in the background. Allow 30 minutes to an hour for a first install, most of it unattended download time. Drawing the model and reading its first finding then takes about 10 minutes.
Before you start
| You need | Details |
|---|---|
| A container engine | Docker with the Compose plugin, or Podman 4.1+ with a Compose provider. On macOS, the Podman machine must be running. |
| Linux or macOS | On Windows, run everything inside WSL. |
| Node.js 18 or later | Only to run the installer with npx. The deployment itself never needs it. Without Node.js, use get-byodt.sh instead. |
| Memory | The database runs with a 4 GB memory limit, and the embedding model adds about 0.9 GB. On Docker Desktop or a Podman machine, the virtual machine's memory is what counts. If it is capped at 4 GB or less, raise it first. |
| Disk | Several GB free in the folder you install into. |
| Internet access | On the first start, to download the images, modules and model. See Network access for the first start. |
Install the platform
Open a terminal in the folder where the deployment should live, such as your home folder. Run:
npx @dether.net/byodt@0.14.0
The installer asks a few questions. Answer them like this:
- npx may ask
Ok to proceed?. Answery. - The installer shows a third-party notice and asks
Continue? [y/N]. Answery. Nothing is downloaded before you do. - It downloads the release, checks it, and unpacks it into a new folder,
./byodt. You see these lines among others:==> SHA-256 matches the release (…). ==> Unpacked release 0.14.0 into ./byodt.
If cosign is installed, it also verifies the signature and prints==> Signature verified: the release workflow of dether-net/dethernety-oss at v0.14.0 signed it.Without cosign, it warns that the bundle's integrity was checked, its authenticity was not and goes on; install cosign to check who published it too. - Setup asks for your settings. Press Enter to keep each default, except the last one:
Question Answer Graph database, memgraph or neo4j [memgraph]:Enter Keep the database in the engine's named volume? [Y/n](Docker Desktop or a Podman machine only)Enter Reach the console and the platform from other machines too (binds 0.0.0.0)? [y/N]Enter Port [3000]:Enter Does this machine reach the internet only through an HTTPS proxy? [y/N]Enter. If you are behind a proxy, see Behind an outbound proxy. Start the stack now? [y/N]yImportant: The default for Start the stack now? is No. If you pressed Enter, setup ends with
==> Ready. Start with: ./byodt/byodt up. Run./byodt/byodt upto start it. - When the stack has started, the installer prints:
==> Up. Console: http://127.0.0.1:3000/console/
That address is the deployment's operator console. The platform itself is athttp://127.0.0.1:3000.
Without Node.js
Run the same install with get-byodt.sh from the release:
VERSION=0.14.0
curl --proto '=https' --tlsv1.2 -fsSL "https://github.com/dether-net/dethernety-oss/releases/download/v${VERSION}/get-byodt.sh" | sh
It asks the same questions. To check the installer's signature before you run it, and for every other option, see With get-byodt.sh from the release.
These commands use the current release; newer releases are listed on the releases page.
Open the platform
The installer returns before the platform is ready. On the first start, the deployment installs its modules and loads the MITRE reference data first, and only then starts the platform.
- Browse to http://127.0.0.1:3000. For the first few minutes, the browser may refuse to connect. Wait and reload. To check progress, see Verify the deployment is healthy.
- The home page loads, with cards for Data Flow Models, Control Catalog, Issues and Modules.
There is no sign-in. A fresh install runs in standalone mode: it is reachable only from this machine, and anyone using this machine has full access to it.
Note: The embedding model keeps downloading in the background. Until it is ready, the class picker shows Semantic search is unavailable on this deployment — showing name-based matches. Typing the class name still finds it. The suggestions get better once the model has downloaded.
Draw the model
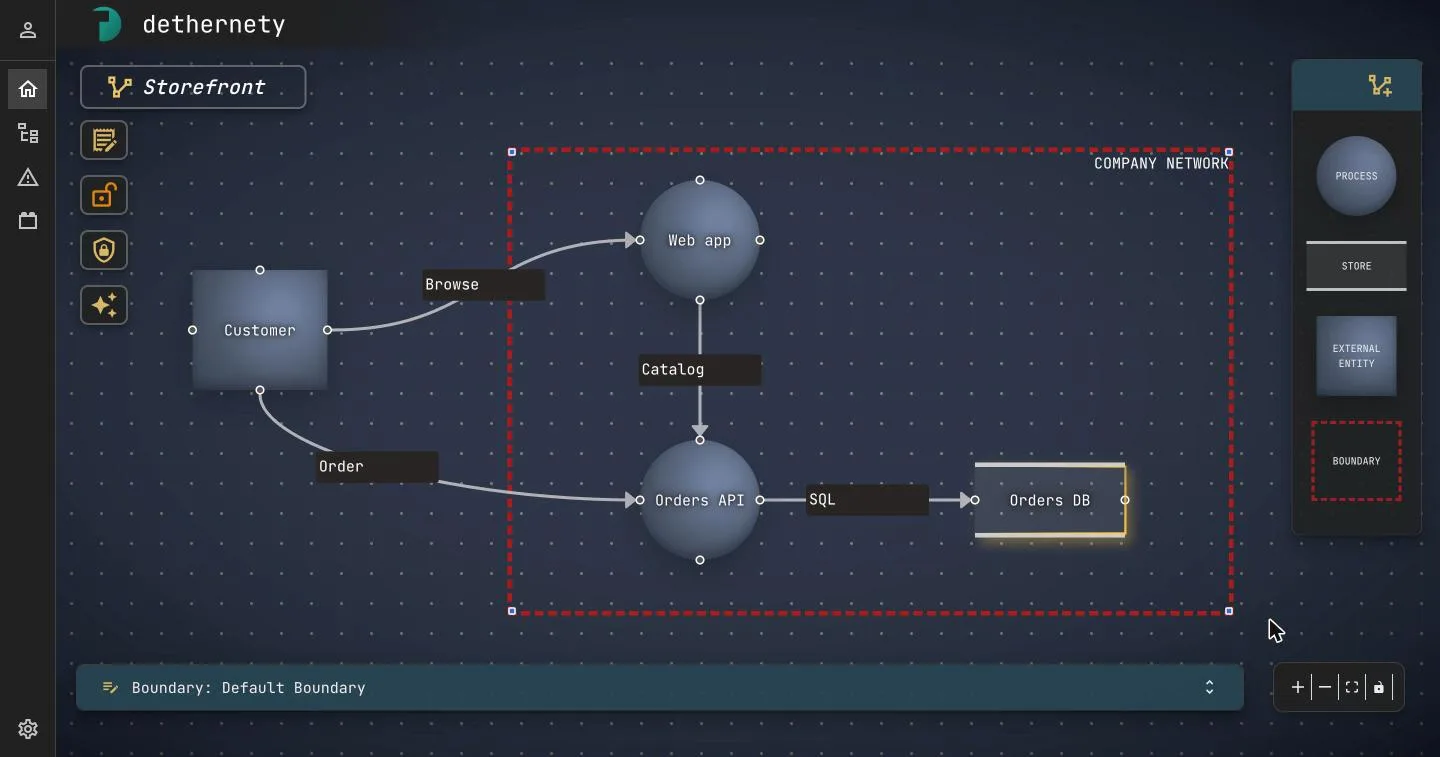
You draw Storefront: a small online store. A customer browses a web app and places orders through an API. The API stores orders in a database. The web app, the API and the database sit inside one company network.
flowchart LR
  Customer[Customer]
  subgraph Net["Company network"]
    Web((Web app))
    API((Orders API))
    DB[(Orders DB)]
  end
  Customer -- Browse --> Web
  Customer -- Order --> API
  Web -- Catalog --> API
  API -- SQL --> DB
Create the model
- In the left rail, click Browser.
- Click the round + button (tooltip Create or import). In the speed dial, click New model. The model dialog opens on the General tab.
- In Name, type
Storefront. - Click Open data flow editor, the unlabelled diagram icon at the far right of the buttons along the bottom of the dialog. It saves the model and opens the empty canvas. The palette on the right lists Process, Store, External Entity and Boundary.
Add the boundary
- Drag Boundary from the palette onto the canvas. Its properties panel opens on the General tab.
- In the Boundary Class field, type
Network Segmentand pick Network Segment. - Replace the Name with
Company network, then click Save. - Drag a corner handle of the boundary to make it big enough for three components.
Tip: Pick the class first, then edit the name, then save. If you change the name and then pick a class before saving, the class pick can be lost.
Note: Skip the boundary's Zoning tab for this quick start. The report then shows two collapsed zoning advisories for Company network: it has no trust zone, and it holds a high-value asset (the crown jewel) whose isolation the model can't show. That's fine. Boundary Trust Zones explains zones.
Add the components
| Name | Palette type | Class | Drop it |
|---|---|---|---|
| Customer | External Entity | End User | On the canvas, outside Company network |
| Web app | Process | Web Server | Inside Company network |
| Orders API | Process | Application Service | Inside Company network |
| Orders DB | Store | Relational Database | Inside Company network |
For each row:
- Drag the palette type to where the table says. The properties panel opens.
- In the Component Class field, type the class name and pick it.
- Enter the Name, then click Save.
Mark the crown jewel
A crown jewel is an asset an attacker would most want to reach. Here, that's the database.
- Select Orders DB.
- On the General tab, click the crown button to the left of the Inherited from a Class switch.
The node gets a gold outline.
Connect the data flows
A data flow's direction is the direction the data travels in.
| From | To | Name | Class |
|---|---|---|---|
| Customer | Web app | Browse | HTTP/S Request |
| Customer | Orders API | Order | API Call |
| Web app | Orders API | Catalog | API Call |
| Orders API | Orders DB | SQL | Database Query |
For each row:
- Point at the source component. Small round connection handles appear on its edges.
- Drag from a handle on the source to a handle on the target, and release. The flow's properties panel opens.
- In the Data Flow Class field, pick the class from the table.
- Enter the Name, then click Save.
Tip: Name every flow. A new flow gets a placeholder name such as New Data Flow, and the report lists flows by name.
Your model is finished:
Why the model already has findings
You haven't answered any of the classes' questions. That is enough for findings. An unanswered question counts as the protection being absent, so the class's rules fire. This is by design: nothing is assumed safe until you say so.
Have a look:
- Select Orders API and open its Attributes tab. The questions are grouped under headings such as Authentication & Access and Application Security. Most are yes-or-no questions that offer Yes, No and Not answered.
- Expand Application Security. Parameterized Queries Used is Not answered.
The questions are marked as required, and an unanswered one shows is a required property in red. That is expected: you can save with questions left unanswered. To see the questions in a larger dialog, Attributes of Orders API, with a guide to each one beside it, click the right-hand of the two buttons at the top right of the tab. - Open the Exposures tab. It shows how many exposures the class derived.
Don't answer anything yet. You come back to this in Try it: answer the questions.
Run the Threat Report
- In the editor, click Analyses (the sparkle icon). A dialog titled Analysis: Storefront opens.
- Click New Analysis, then Threat Report.
- A row appears with the status Ready. Click Run.
- The status changes to Done. Click View results.
The report opens on its Posture tab. The header reads 4 components · 2 boundaries. The boundary count includes the Default Boundary, which is the canvas itself.
Expect 73 open findings for this model: 14 Critical, 48 High and 11 Medium. Your numbers may differ with the module versions on your deployment.
Each finding's band comes from its score; Severity bands gives the ranges.
Read the first finding
On the Posture tab, Top residual risks lists the open findings, ranked by band, then score, then name. The first row shows:
| Part | Meaning |
|---|---|
| Critical | The band. |
| Injection (SQLi / NoSQLi / OS command / LDAP) | The finding. |
| network | The attack vector: the attacker comes over the network. |
| on Orders API | The element it was found on. |
| ⛉ uncovered | No security control on the element supports it. |
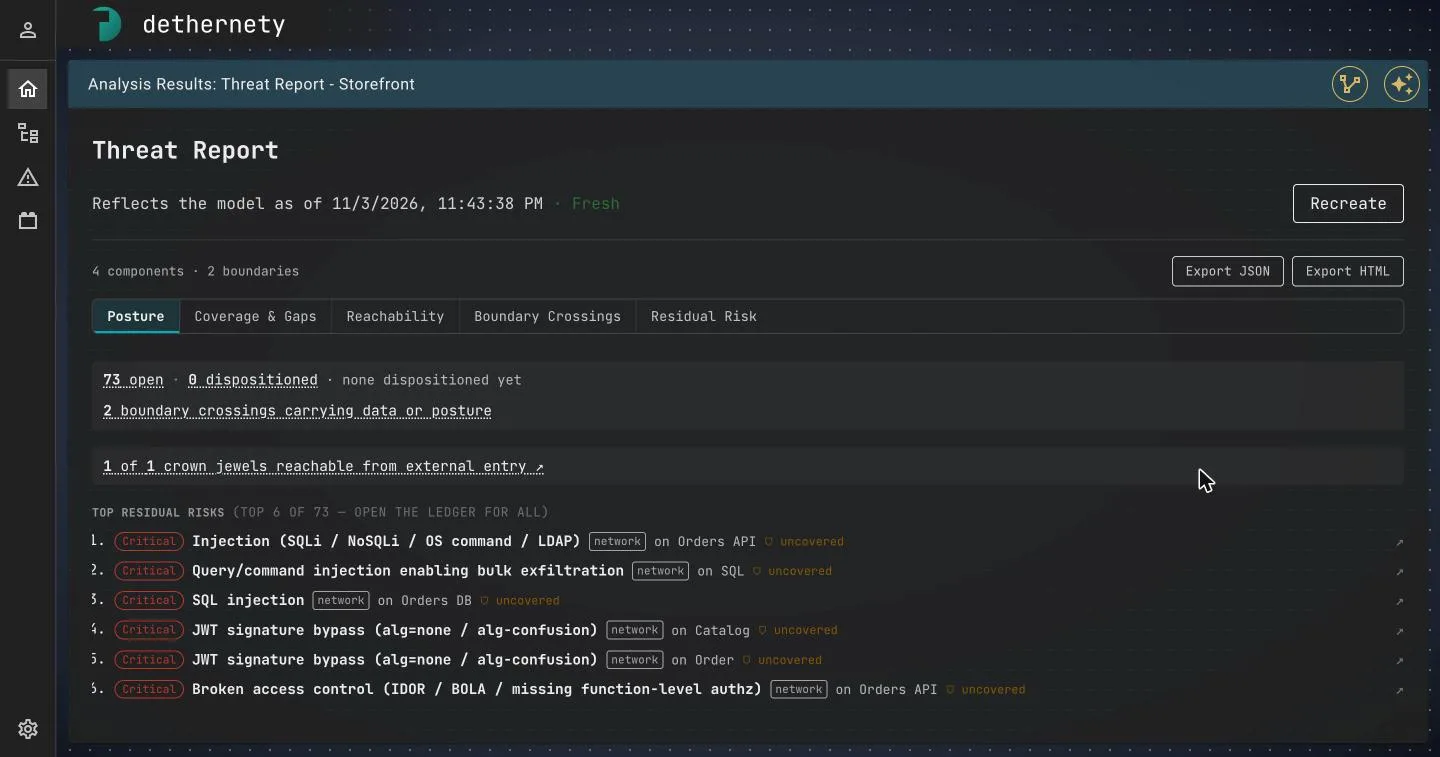
Click the row. The Orders API's Component Profile opens, with its findings.
On the Residual Risk tab, the Orders API group's row for this finding shows its score, 9.8, and two MITRE ATT&CK technique chips: T1059 and T1190. Hover over a chip for the technique's name: Command and Scripting Interpreter and Exploit Public-Facing Application.
What it means
The application builds queries or shell commands from input it hasn't validated. An attacker can then read or change the stored data, or run commands on the host. Parameterized statements, running commands with an argument array, and server-side allow-list validation defeat it.
Why it fired
The Application Service class raises this finding when any of these is true:
- Parameterized Queries Used is not Yes.
- OS Commands Avoided Or Arg-Array Used is not Yes.
- Server-Side Allowlist Validation Applied is not Yes.
- Dynamic Query-String Concatenation Used, User Input In Shell Command String, Validation Is Client-Side Only or Denylist Filtering Used is Yes.
The first three are Not answered, so it fires.
How it reaches your data
Open the Reachability tab. It reads 1 of 1 crown jewels reachable from external entry. Entry points are the model's external entities: here, Customer.
For Orders DB, it shows reachable · shortest route 2 hops · 1 crossing, and worst on any route: Critical.
Click view strip beside it to see the routes:
- The shortest route is Customer → Orders API → Orders DB.
- A second route goes through Web app.
- Every route passes through Orders API, the element with the injection finding.
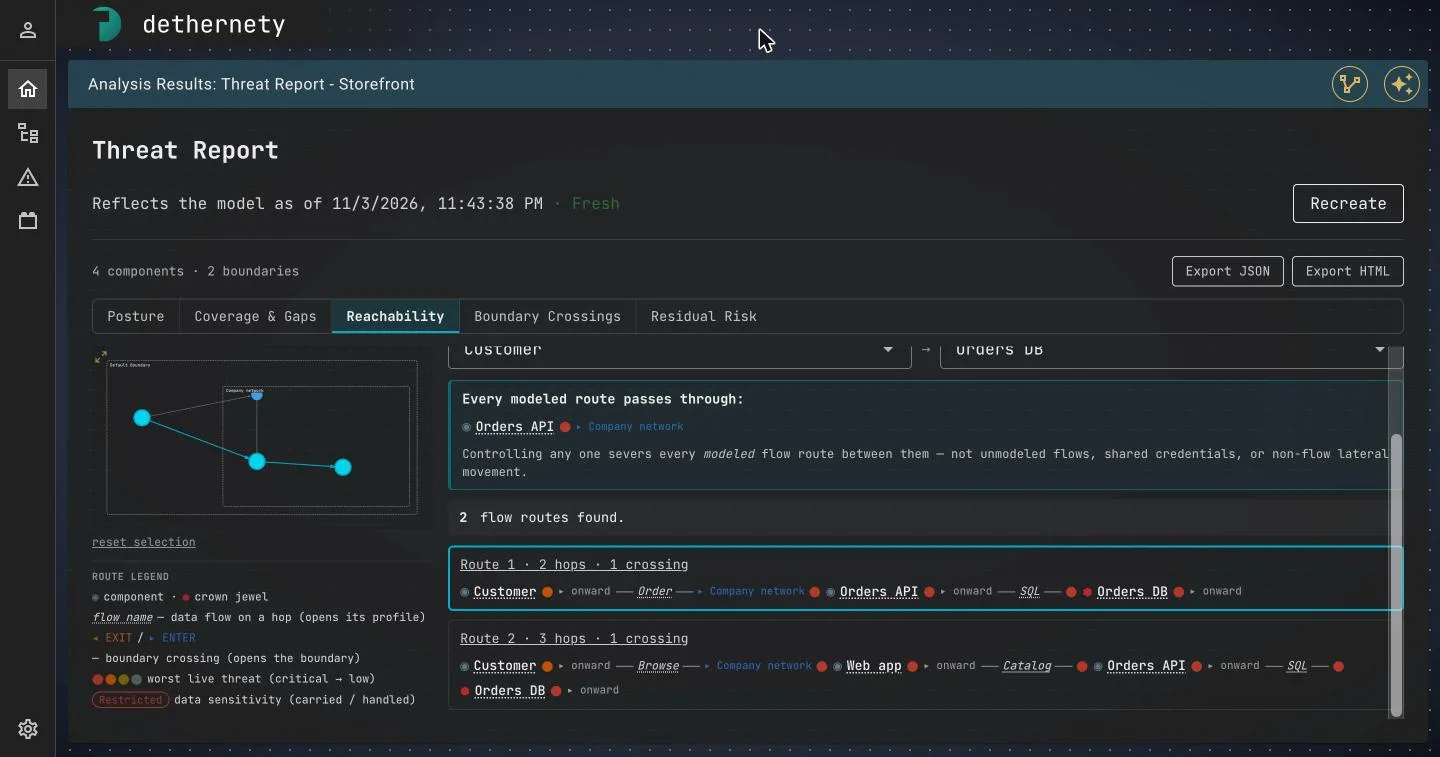
The tab says it plainly: Flow routes and the threats on them — not attack paths. Reachability and Flow Routes explains how to read it.
Try it: answer the questions
Tell the platform that the Orders API is protected against injection.
- Go back to the editor: click the diagram icon at the top right of the report. A model you reopen opens in view mode, so click the padlock on the left to edit.
- Select Orders API, open its Attributes tab and expand Application Security. Set exactly these three questions to Yes:
- Parameterized Queries Used
- OS Commands Avoided Or Arg-Array Used
- Server-Side Allowlist Validation Applied
- Leave every other question as it is, and click Save.
Important: Some questions in Application Security describe a weakness, such as Denylist Filtering Used. For those, Yes makes the finding fire. Answer only the three above.
The platform evaluates the class again and removes the Injection finding.
Important: Here you only claim the protections, to see how answers drive findings. On a real model, answer Yes only for a protection you have checked is in place. A Yes that isn't true removes the finding from the report, not the risk. For a finding that doesn't apply, record why instead: see Managing Findings.
The report is a snapshot, so it doesn't change by itself. Open it again (Analyses, then View results): its marker has turned from Fresh to Stale. Click Recreate. The report now counts 72 open findings, and the top row of Top residual risks is Query/command injection enabling bulk exfiltration on the SQL flow, also scored 9.8.
Stop and start the deployment
From the folder you ran the installer in:
./byodt/byodt down    # stop; everything on disk is kept
./byodt/byodt up      # start again
Later starts take well under a minute.
Next steps
- Building Your First Model: a fuller model, with trust zones and issues.
- Threat Report guide and Reading the Report: every tab of the report.
- Reachability and Flow Routes: routes to your crown jewels.
- Managing Findings: affirm the findings that are real and dispose of the ones that aren't.
- Component Configuration Guide: answer attributes and classify the data your components handle.
- Installing the BYODt Deployment: every install option.
- Dethereal plugin: build models in conversation with Claude Code.